
Earthquakes are our friends
Earthquakes are our friends
We usually think about disasters when we talk about earthquakes; but they carry important information from deep below our beloved planet...

In the second episode of Geologica, we will try to understand earthquakes better; we will see what a seismic wave travels and how faults generate them. Earthquakes are the subject of seismology, a branch of geophysics (which is a branch of Geology) that helps us see inside the Earth.
Have you ever got a TC scan? Soundwaves propagate in your body and return to the physician’s screen monitor depicting the shapes of your internal organs. In the early 1900s seismologists learned to do something similar with buried Earth structures by analyzing earthquake recordings: the seismographs.
We tried to have a quick look at what an earthquake is in an early post here in Geologica. Let’s try to add some deeper insight to it.
In 1906, Henry Fielding Reid, (1859 – 1944), professor of geology at the Johns Hopkins University was examining the surface displacements occurred after the San Francisco earthquake. Fences were displaced, as well as railways, tree lines, even water streams. The displacement appeared to have the same characteristic: the displaced part always appeared to have moved to the right with respect to the other.
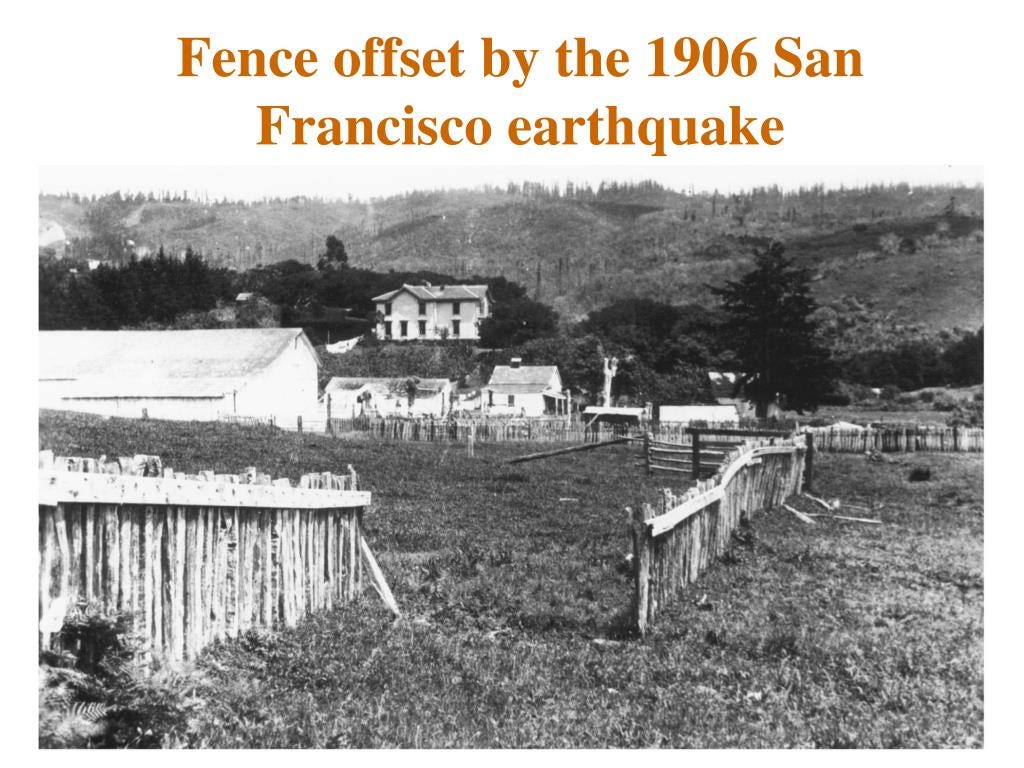
It all looked to Reid like an enormous amount of stress had accumulated until it suddenly fractured the rock causing the earthquake and those evident displacements along a line we call a “fault” (the infamous San Andreas fault in his case). He came to the conclusion that the earthquake must have caused an “elastic rebound” of the accumulated stress.
If a piece of rubber is broken or cut, the elastic energy stored during deformation will be released at once. In the same way, Earth’s crust can gradually store elastic stress to be suddenly released during an earthquake. This gradual accumulation and sudden release after deformation is called Reid’s “elastic rebound theory” of earthquakes.

The elastic rebound generates elastic waves within the rock. Some are very similar to those caused by a rock thrown in the water. From the point of origin they propagate in circles, which are actually the intersections between the spherical wave fronts and the water surface. Seismic waves travel in all directions in a similar way from the point of origin, the ipocenter (where the rupture or slip along a fault plane has occurred at a certain depth underground).

But an earthquake occurs in a solid body, not in water (although it can propagate in it); two main types of elastic waves can propagate in a solid body independently: “longitudinal waves” and “transverse waves”.
The former are the alternating compressions and dilatations generated by the elastic rebound, therefore they are also called compressional waves. Their vibration occur along the direction of propagation. The transverse waves are generated by the slip along the fracture surfaces and their vibrations occur on perpendicular planes to the direction of propagation; they are also called shear waves.
Longitudinal waves are faster and reach the measuring instruments earlier, being recorded as P waves (pressure waves, “a” in the picture below).

After a while, transverse waves are also recorded as S waves (shear waves, “b” above). A third group of waves should concern us more, since they travel only along the Earth’s surface: the L waves (long waves). Rayleigh’s waves (“d” in the picture above) cause the terrain to vibrate along retrograde elliptical orbits with respect to the direction of propagation. Love’s waves (“c”) cause the terrain to vibrate along the horizontal plane. The movement of the points the waves pass through is transverse and horizontal with respect to the direction of propagation.

Therefore, faster P waves are the first impulse on a seismograph; the slower S waves (that cannot be generated, nor they propagate in fluids) arrive later. The delay between the arrival times of P and S waves at a recording station is therefore a function of the distance of the measuring station from the epicenter. Putting together seismographs of the same earthquake from different stations we obtain curves called dromochrones, which connect the P and S waves arrival times on the diagram (below).

With a simple graphing procedure it is possible to locate the epicenter area of an earthquake by knowing its distance from at least three different recording stations. Three circles centered on the stations, with a radius equal to the station’s distance from the epicenter (calculated from the P and S waves arrival times), will overlay at the epicenter area (below).

The energy released by an earthquake (Newton x meter) is today expressed as seismic moment M0, obtained by multiplying the fractured area times the average displacement along the fault times the rigidity of the involved rocks (the shear modulus representing the stress/strain ratio at the fault). It is generated by computer calculations on the seismographs and it is a measure of the energy released by earthquakes according to the moment magnitude scale (MMS).
Charles Francis Richter (1900 – 1985), American seismologist at Caltech, is the father of modern magnitude scales used to “measure” earthquakes. In 1935, after suggestion from his colleague Beno Gutenberg of the same university, he used a logarithmic scale in the attempt to relate the seismographs’ wave amplitudes to the distance from the epicenter (an idea inspired by an article by the Japanese seismologist Kiyoo Wadati).

He soon realized how comfortable it was to use the amplitudes’ base 10 logarithm for graphing the values (the diagram’s dimensions would have grown too large otherwise). In developing his famous Richter scale, he chose the measuring unit as the earthquake that caused a 1 mm maximum displacement on a particular type of seismographer at a 100 km distance from the epicenter. This would have defined Magnitude = 0 (Log 1 = 0), a word he borrowed from his passion for astronomy, where it represents the brightness of stars. The nomograph below can be used to manually calculate the Richter Magnitude ML (local Magnitude) from the maximum amplitude measured on the seismograph and the epicenter distance.

Since the Richter Scale is logarithmic, any value increment in the scale corresponds to an increment of 10 in measured earthquake amplitude (any magnitude increase of one unit is 31.6 times bigger in terms of energy).
The most widely used scale today is the more modern MMS (Moment Magnitude Scale), especially for earthquakes larger than ML = 4. Developed in 1979 by seismologist Hiroo Kanamori of Caltech along with Thomas C. Hanks of the USGS, the moment magnitude scale is based on the seismic moment M0 = μDA, a quantity equal to the product of the rock’s rigidity modulus μ, times the mean displacement D along the fault, times the area A of the fault’s portion that moved. Kanamori identified a relationship between seismic moment and energy released by an earthquake and defined a moment magnitude Mw (W = work, work) in a formula that he refined with Hanks:
Mw = 2/3 log (M0) – 10.7
where M0 is the seismic moment and the constants were added to make the MMS scale consistent with previous Richter scales.
Intensity scales such as the Mercalli Scale are used to describe the effects caused by an earthquake, which depend on local conditions. An earthquake of a certain magnitude may have different consequences if it takes place in a desert or in a town.

Giuseppe Mercalli, (1850 – 1914), Italian abbot and seismologist, first created a 10 degree scale that was later upgraded by the Italian physicist Adolfo Cancani and the German geophysicist August Seiberg to become the Mercalli-Cancani-Sieberg (MCS) scale. Richter himself finally modified it in the current Modified Mercalli (MM) 12 degree scale. By collecting evidence on the damage and effects of an earthquake the MCS scale makes it easy to quickly approximate the epicentral area and estimate the extent of the geological structures involved in the earthquake.
I hope now you have a better picture of what earthquakes are and on how they are measured and ranked. Next time we will see how we infer information about the insides of the Earth from the way they propagate…